Open Source Compute Scheduler
The Compute Gardener Scheduler is a Kubernetes scheduler plugin that solves a key challenge: optimizing when and where workloads run based on real-time carbon intensity data. With robust pod-level tracking and metrics, you get precise visibility into your workloads' energy consumption and carbon footprint. The scheduler helps teams make meaningful progress on sustainability goals while maintaining operational excellence.
Key Features
Core Features
Carbon-Aware Scheduling
- Schedule pods based on real-time carbon intensity data
- Connect to Electricity Map API or create custom intensity sources
- Built-in caching to limit external API calls
- Track and measure impact with detailed metrics
Comprehensive Metrics
- Track carbon intensity, energy usage, and cost metrics
- Measure actual carbon and cost savings
- Monitor resource utilization at pod and node level
- Prometheus integration for observability
Additional Capabilities
Price-Aware Scheduling
- Schedule based on time-of-use electricity pricing
- Define custom pricing schedules via YAML
- Pod-level controls via annotations
- Configurable scheduling delays with flexible time formats
Energy Budget Tracking
- Define and monitor energy usage limits for workloads
- Configurable actions when budgets are exceeded
- Track energy usage over pod lifecycle
- Namespace-level energy budgets for workload groups
Hardware Power Profiling
- Automatically detect node hardware to determine power profiles
- Map cloud instance types to their hardware components
- Accurate power modeling with datacenter PUE consideration
- GPU-specific power profiles for workload types
Advanced Policies
- Define team-based energy quotas at namespace level
- GPU workload classification for inference, training, and rendering
- Enable gradual adoption by starting with specific namespaces
- Workload-type optimization for batch jobs, services, and stateful workloads

Configuration
Prerequisites
- Metrics Server (Recommended): Without it, the scheduler won't be able to collect real-time node utilization data, resulting in less accurate energy usage estimates. Core carbon-aware and price-aware scheduling will still function using requested resources.
- Prometheus (Recommended): For visualizing scheduler performance metrics and validating carbon/cost savings. The scheduler will continue to function without it, but you'll miss valuable insights.
Environment Variables
# Required: Your API key for Electricity Map API
ELECTRICITY_MAP_API_KEY=<your-api-key>

# Optional: Default is US-CAL-CISO
ELECTRICITY_MAP_API_REGION=<region>

# Scheduling: maximum delay before a held pod is force-scheduled
MAX_SCHEDULING_DELAY=24h

# Carbon: enable/disable and set the gCO2/kWh threshold
CARBON_ENABLED=true
CARBON_INTENSITY_THRESHOLD=200.0

# Pricing: enable time-of-use electricity price scheduling
PRICING_ENABLED=false

# Observability
LOG_LEVEL=info
Pod Annotations
# Opt out of compute-gardener scheduling entirely
compute-gardener-scheduler.kubernetes.io/skip: "true"

# Per-pod carbon threshold override (gCO2/kWh)
compute-gardener-scheduler.kubernetes.io/carbon-intensity-threshold: "250.0"

# Per-pod price threshold override ($/kWh)
compute-gardener-scheduler.kubernetes.io/price-threshold: "0.12"

# Cap how long this pod can be held before force-scheduling
compute-gardener-scheduler.kubernetes.io/max-scheduling-delay: "12h"

# Energy budget in kWh and action when exceeded (log, notify, annotate, label)
compute-gardener-scheduler.kubernetes.io/energy-budget-kwh: "5.0"
compute-gardener-scheduler.kubernetes.io/energy-budget-action: "notify"

# GPU workload type for accurate power modeling (inference, training, rendering)
compute-gardener-scheduler.kubernetes.io/gpu-workload-type: "inference"
Namespace-Level Energy Policies
Apply defaults to every pod in a namespace without per-pod annotations:
# Enable energy policies for this namespace
labels:
  compute-gardener-scheduler.kubernetes.io/energy-policies: "enabled"

annotations:
  compute-gardener-scheduler.kubernetes.io/policy-carbon-intensity-threshold: "200"
  compute-gardener-scheduler.kubernetes.io/policy-energy-budget-kwh: "10"
  compute-gardener-scheduler.kubernetes.io/policy-energy-budget-action: "notify"

  # Workload-type overrides (batch, service, stateful)
  compute-gardener-scheduler.kubernetes.io/workload-batch-policy-energy-budget-kwh: "20"
Hardware Power Profiles
The scheduler uses hardware-specific power profiles to accurately estimate energy consumption rather than relying on generic defaults. Profiles cover CPU idle/max wattage, GPU workload coefficients (inference, training, rendering), memory power per GB, and datacenter PUE factors.
- Cloud instance auto-detection maps AWS, GCP, and Azure instance types to their underlying hardware automatically
- Hybrid/on-prem support via node labels or runtime detection for bare-metal and private cloud
- GPU workload classification applies per-type power coefficients so an inference job isn't modeled the same as a training run
- PUE consideration factors in datacenter overhead for accurate carbon accounting
The full hardware profile ConfigMap schema — including CPU, GPU, memory profiles, and cloud instance mappings — is documented in the GitHub repository.
Observability & Metrics
The scheduler exports comprehensive Prometheus metrics for monitoring:
- Carbon and Pricing Metrics: Current carbon intensity, electricity rates, scheduling delays
- Energy Budget Metrics: Budget usage percentage, exceeded budget counts, job energy usage
- Hardware Efficiency Metrics: Node PUE, efficiency metrics, power-filtered nodes
- Resource Utilization Metrics: CPU, memory, and GPU usage across nodes
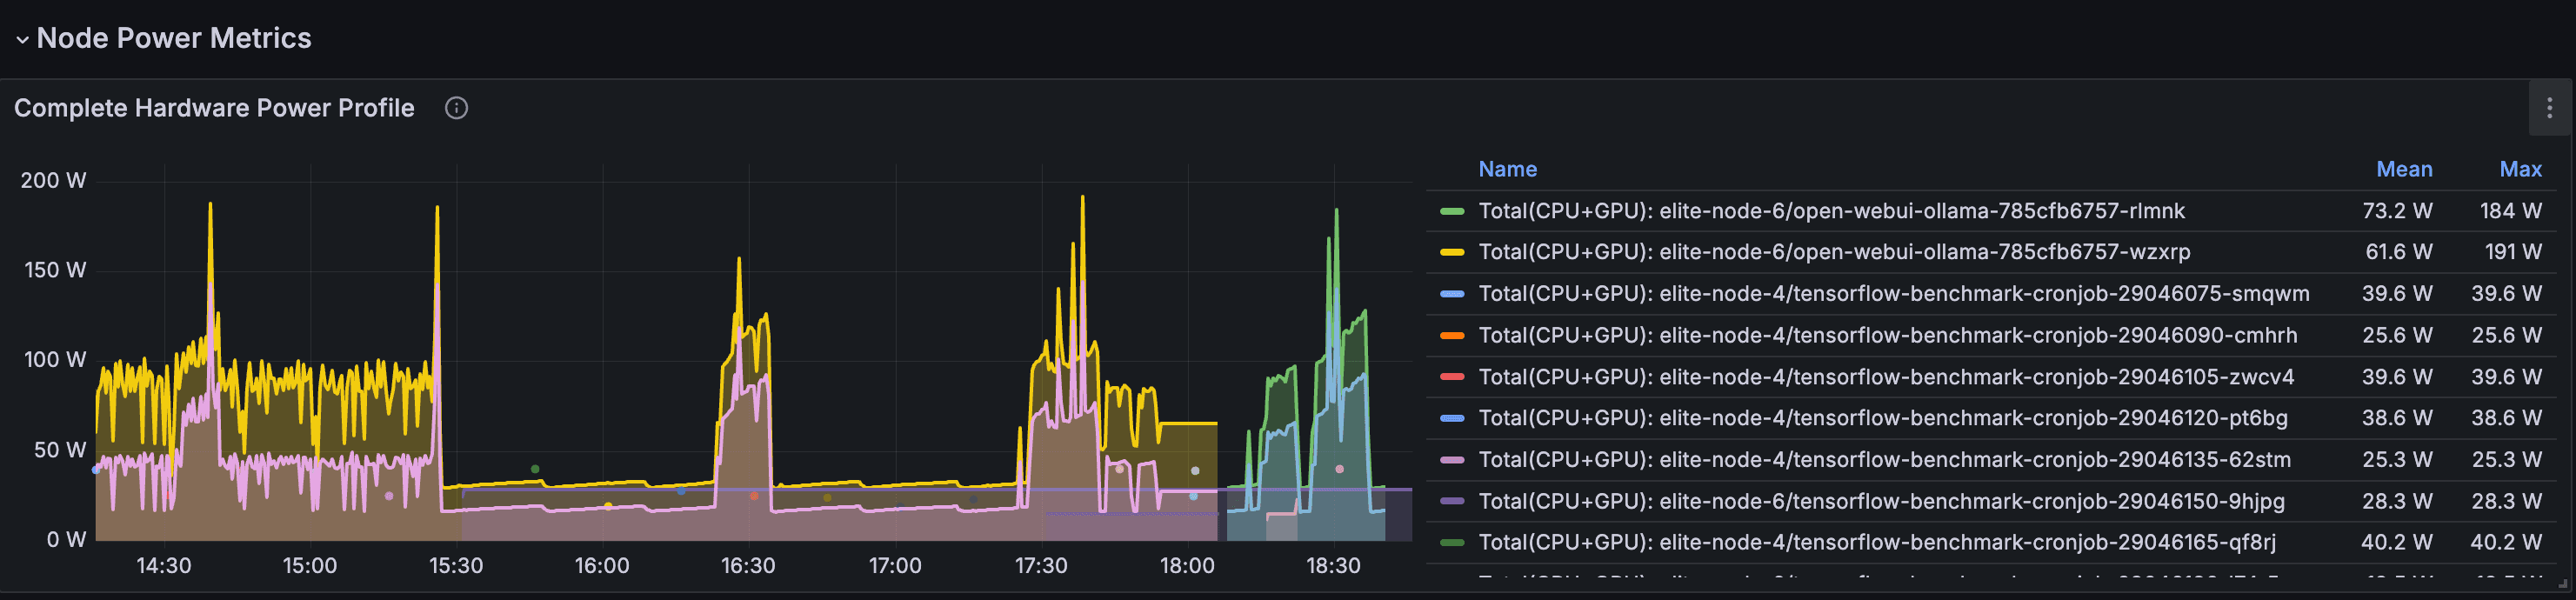
- Power Estimation Metrics: Estimated node power consumption with PUE consideration
- Carbon Emissions Metrics: Estimated job carbon emissions in grams of CO2
- Scheduler Performance: Scheduling attempts, latency, estimated savings
- Metrics System: Sampling counts, cache size, and system health
These metrics help validate the scheduler's behavior, measure carbon and cost savings, and ensure optimal performance.
Metrics Integration
The scheduler exposes metrics through multiple integration methods:
- Health checks on port 10259 (HTTPS) path /healthz
- Metrics on port 10259 (HTTPS) path /metrics
- Built-in ServiceMonitor resources for Prometheus Operator
- Prometheus annotation-based discovery support
- Configurable sampling intervals and downsampling strategies
- Customizable metrics retention for completed jobs
Example Metrics
# Carbon intensity and electricity rate metrics
scheduler_compute_gardener_carbon_intensity{region="US-CAL-CISO"} 214.56
scheduler_compute_gardener_electricity_rate{region="US-CAL-CISO"} 0.28

# Energy budget tracking metrics
scheduler_compute_gardener_energy_budget_usage_percent{
  namespace="ai-training",
  pod="training-job-1"
} 78.5

scheduler_compute_gardener_job_energy_usage_kwh{job="batch-job-123"} 4.75
scheduler_compute_gardener_job_carbon_emissions_grams{job="batch-job-123"} 1023.8

# Hardware efficiency metrics
scheduler_compute_gardener_node_pue{node="worker-1"} 1.15
scheduler_compute_gardener_node_power_estimate_watts{node="worker-1"} 267.4
Common Use Cases
ML/GPU Workloads
Run AI training jobs when carbon intensity is lowest, with specialized power profiles for GPU workload types.
Read case study: 30% carbon reduction →Inference Services
Monitor energy usage of services without impacting SLAs, while gaining insights about optimal scheduling windows for future deployments.
Batch Processing
Schedule data processing jobs during low-cost electricity periods with configurable scheduling delays.
Energy Budgeting
Track workload energy usage with configurable alerts as budgets approach limits, enabling proactive planning while maintaining service availability.
Multi-Cloud Optimization
Accurately model power across different cloud providers using hardware profiles and PUE configurations.
Research & Academia
Measure energy consumption of compute-intensive research workloads while still maximizing resource utilization with flexible scheduling policies.
Learn More
Join Our Community
Get involved with the Compute Gardener community. Ask questions, share your experience, and contribute to making computing more sustainable.
Stay Updated
Get updates about new features, carbon optimization tips, and community highlights.